News

Changes for release 6.6.0, compared to release 6.5.0

12 January 2022

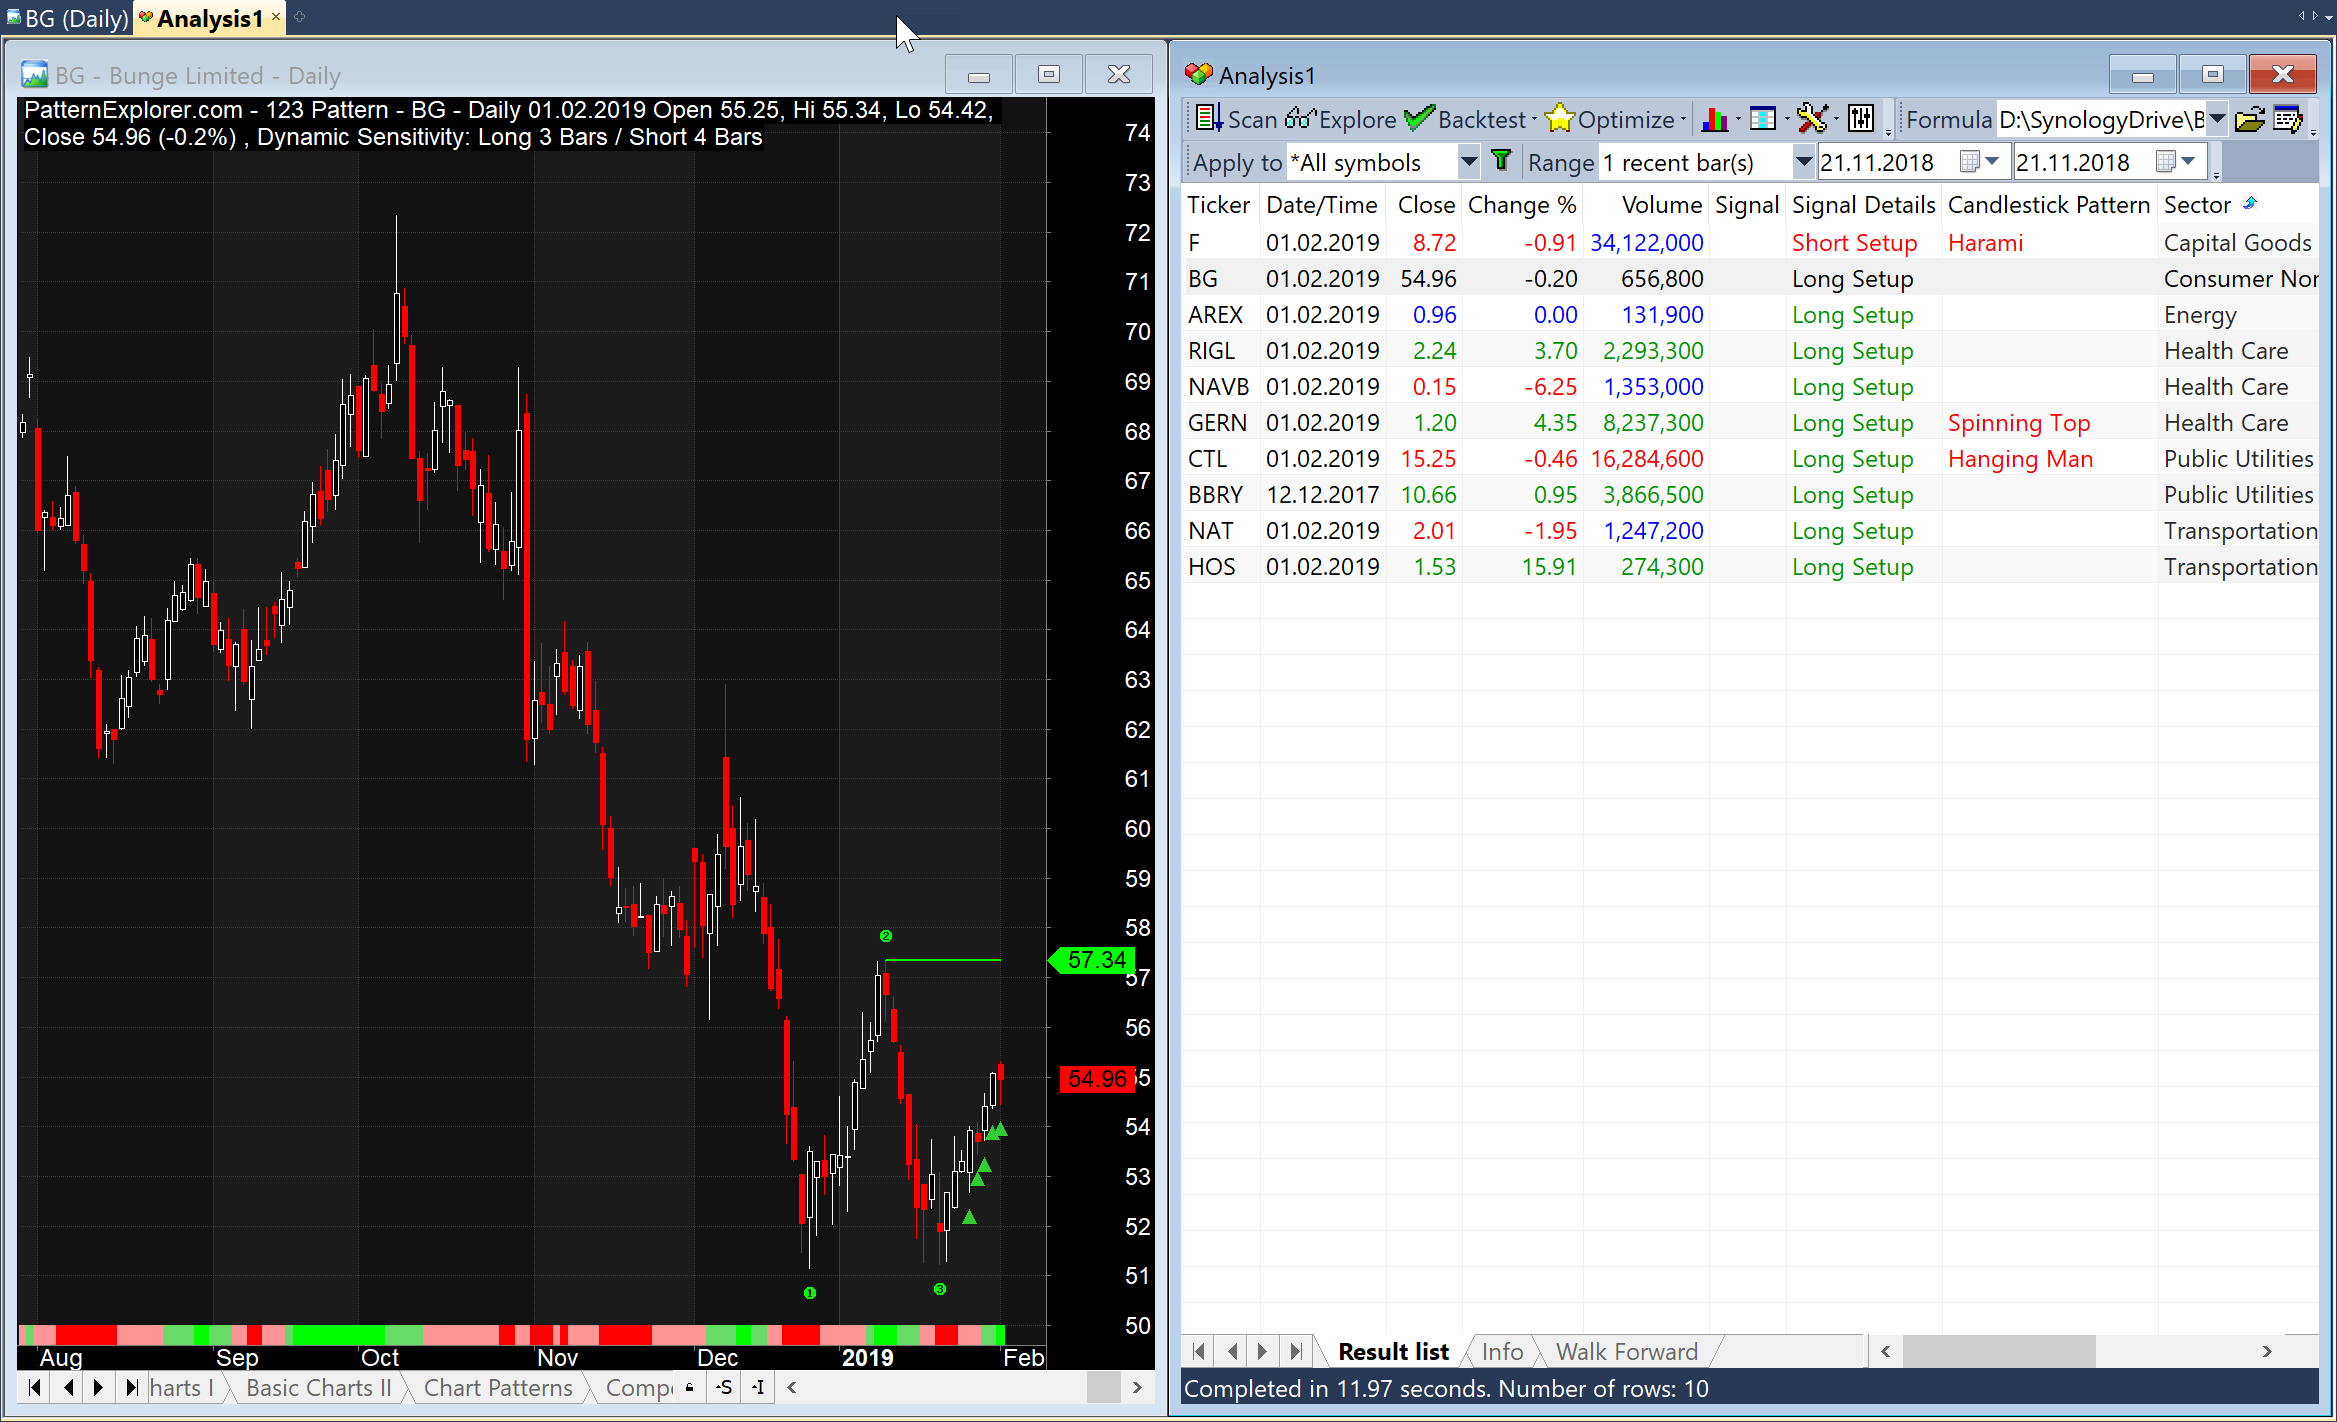
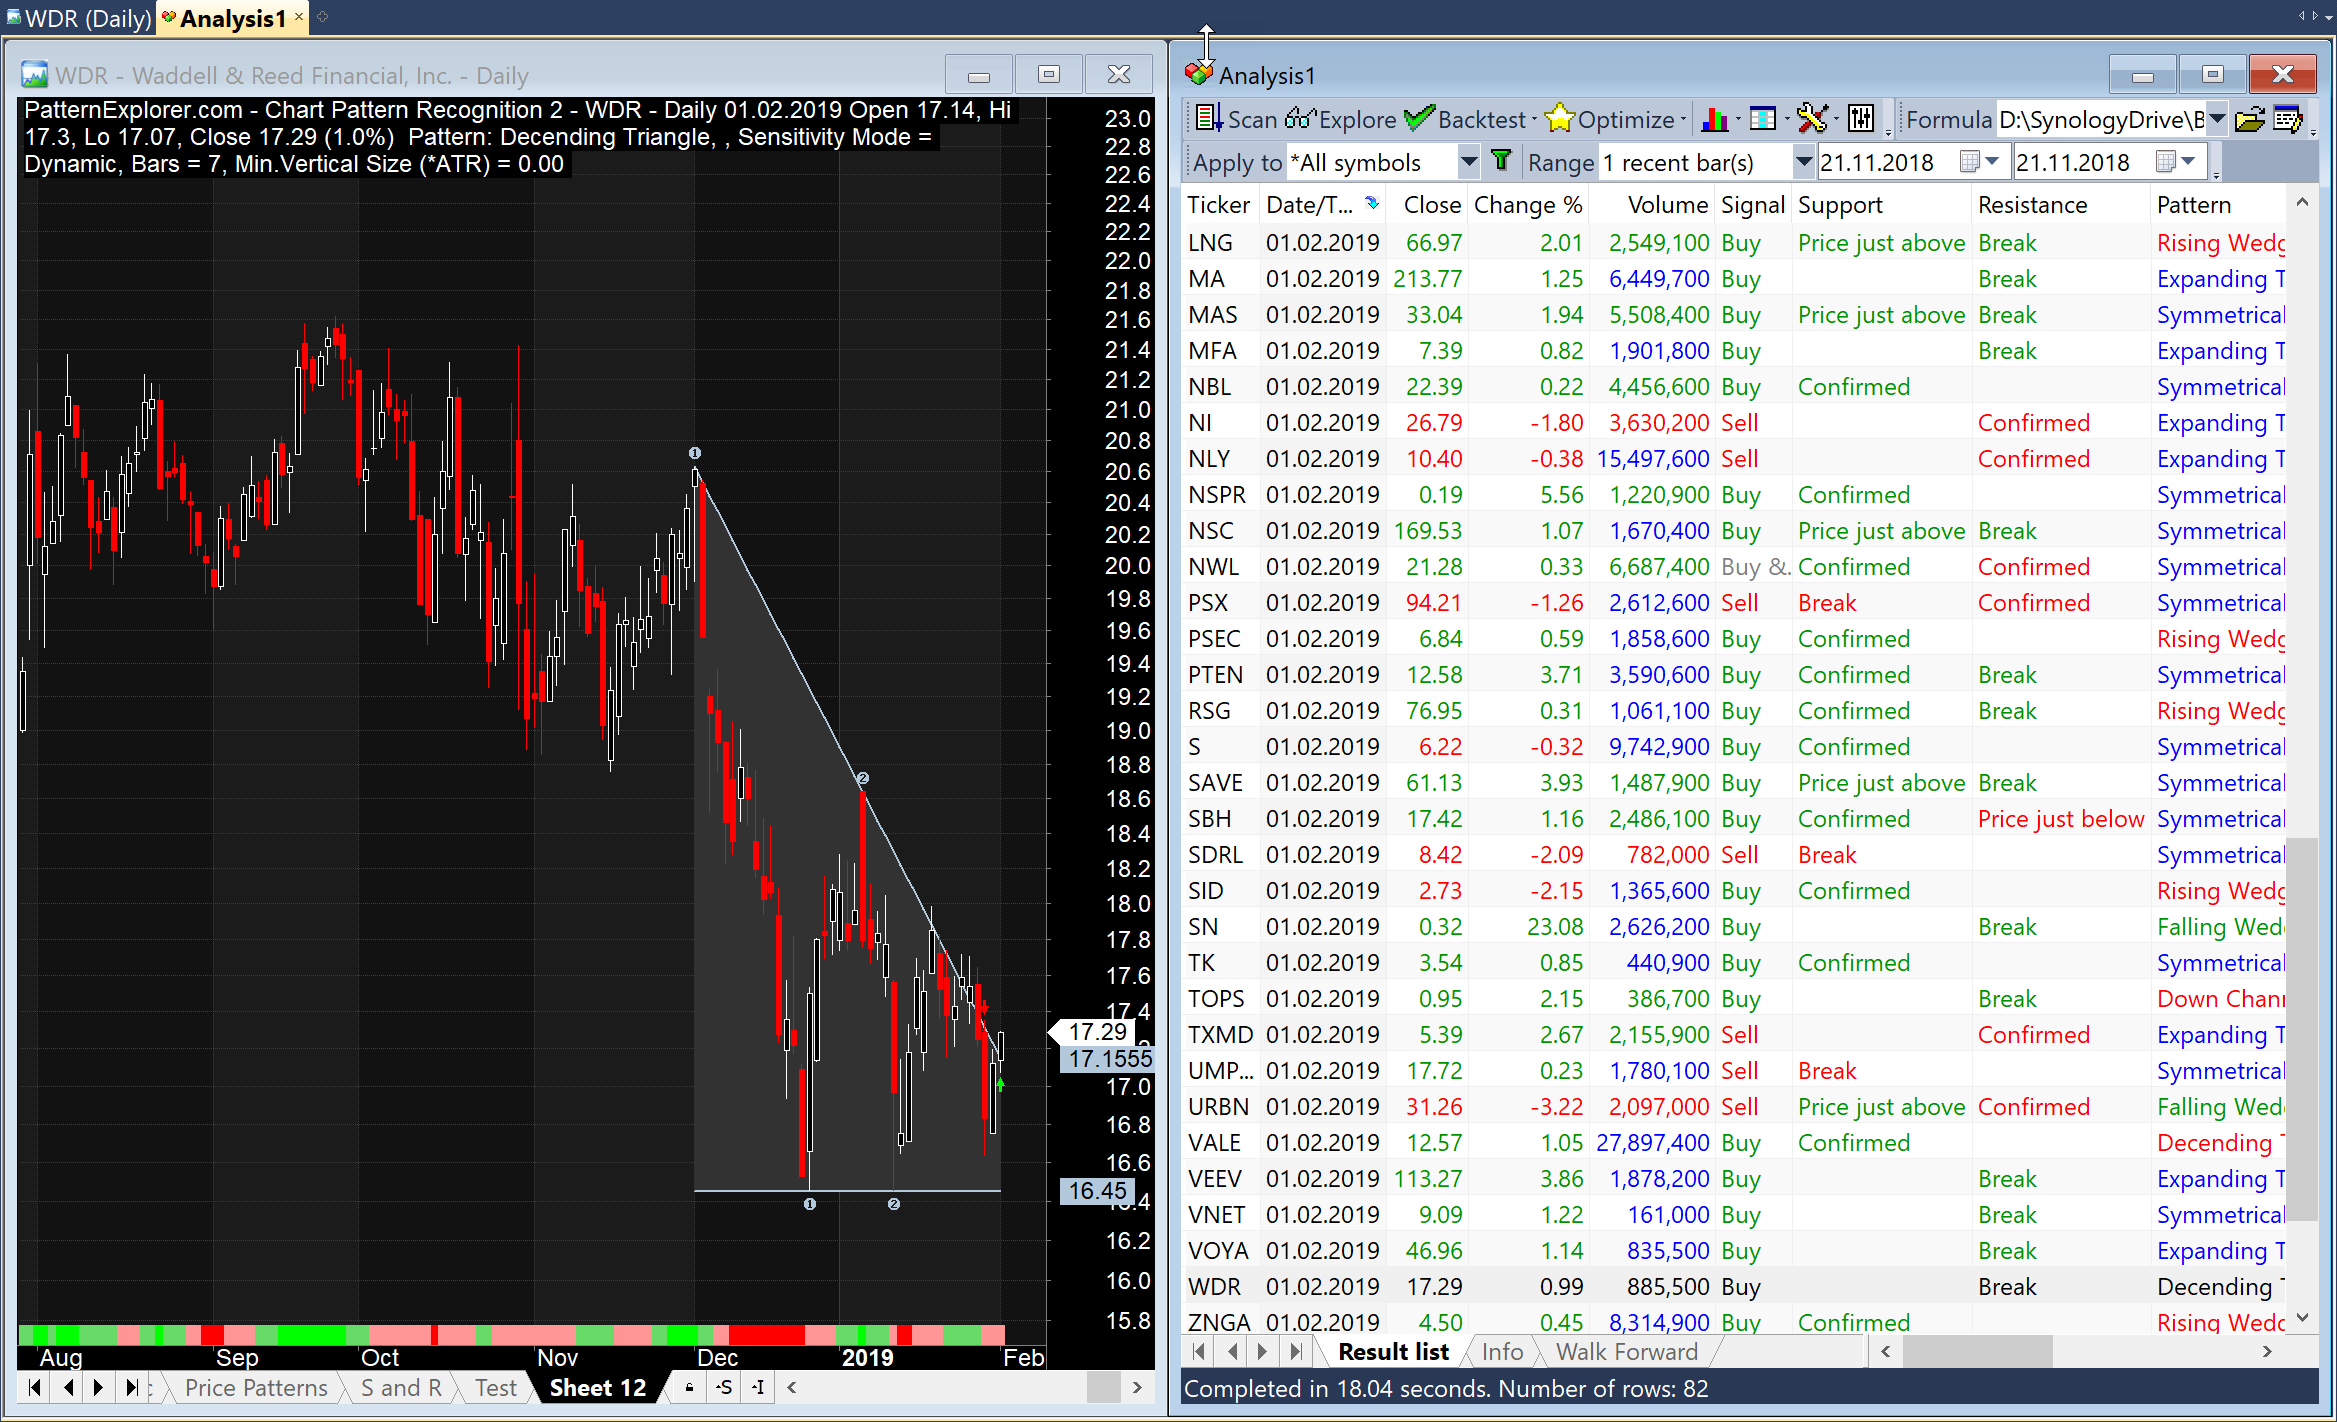
  • Colors in automatic analysis have been simplified to the same color per row depending on the signal. In previous versions many cells inside the table had different colors which made it difficult to interpret the signal. Furthermore AmiBroker now gives the option to set dark mode for list view which requires colors that are readable in dark mode as well. The PE  - Configuration.afl file contains now additional variables in section 7.1 to define text colors for dark and light list view for different signal types like buy, sell, short, cover, long and short setup, breakouts and more. 
  • Minor bug fixes
  • Maintenance update
    Screenshots: LightListView  DarkListView
  • The candlestick pattern column has been disabled in the new version as it might confuse users when they see a green (bullish) automatic analysis line while at the same time the candlestick pattern is bearish. The column, however, can be added manually easily to all tools.
    Just open the file PE - Configurations.afl and scroll down to section 21. Then, uncomment AddCandleColumn(); as shown in the code below.
     
     
    ///    SECTION 21 - Add custom code after PatternExplorer code.
    /// -----------------------------------------------------------------------------------------
    procedure AddCustomCodeAfterPE()
    {
        if(FormulaName == "PE - Alert 1 - Price")
        {
            // AddColumn(H == HHV(H, 20), "H == HHV(H, 20)", 1.0);
            // Example to add a column after all PatternExplorer columns in PE - Alert 1 - Price.
        }
        
       if(InAA)
       {
          AddCandleColumn();
       }

        AddTextColumn(SectorID(1), "Sector", 1.2, aaTextRowColor);
        AddTextColumn(IndustryID(1), "Industry", 1.2, aaTextRowColor);
        AddTextColumn(FullName(), "Full name", 1.2, aaTextRowColor);
    }

Changes for release 6.5.0, compared to release 6.4.0

21 September 2020

  • Maintenance update

New website

20 June 2020

  • We are proud to present our new website after being 15 years in business already. It's time to celebrate this event.
  • Some changes on the website like a new logo will follow.

Changes for release 6.4.0, compared to release 6.3.0

15 May 2020

  • This is a maintenance update.
  • We have optimized the setup and plugin for better performance

Changes for release 6.3.0, compared to release 6.2.0

21 March 2020

  • Added Sash candlestick pattern
    This pattern starts with a black long body followed by a white long body that opens inside the body of the previous candlestick. The white long candlestick closes above the high of the previous candlestick.  Opposite rules for bearish signals. See the pattern in action: https://youtu.be/56aArcZgJQ0
  • Fixed long body candlestick definition
  • Changed duration of support and resistance lines based on candlestick patterns from unlimited to 15 bars.
  • Added Long/Short description to the alerts of the 123 pattern tool
  • Fixed: PE - Configuration: Changed default line width from -15 to -5. Lines have been to thick on certain screen resolutions.
  • Miscellaneous maintenance updates

Changes for release 6.2.0, compared to release 6.1.0

25 August 2019

  • PE - Configuration file
    • def_UseParametersFromChart has been changed from true to false to assure that signals are generated in automatic analysis when there is no inserted chart available.
  • Updated the code certificate

Changes for release 6.1.0, compared to release 6.0.0

23 May 2019

Bug fixes:

  • TAIO indicator: "Range below zero" color wasn't correct
  • TAIO Shadow was overlayed with indicator lines
  • Candlestick patterns bug fixes

Changes for release 6.0.0, compared to release 5.5.0

24 February 2019

We have released a new version with lots of improvements.

  • All tools
    • Changed WriteVal() to NumToStr() for compatibility with newer AmiBroker version.
    • Added a sector and industry column.
    • Moved the candlestick pattern column further to the right side in the automatic analysis window to focus on the tool specific results.
    • Candlestick patterns are displayed historically now in the exploration columns
    • Buy/Sell and Short/Cover column renamed to Signal and removed the existing Short/Cover column.
    • Signals are displayed as Buy/Sell/Short/Cover instead of B/S and S/C
    • Static parameters introduced for all parameters. In previous versions, only the sensitivity parameter has been made static. Chart parameters are separate from automatic analysis parameters. Through static parameters, the settings are automatically synchronized whenever the parameter in the chart will be changed.
    • Static parameters can be activated separately for all alerts and all other remaining parameters.
    • Removed some unused parameters and renamed existing parameters and column names
    • Changed term symbol and ticker to market in many places
    • Improved and simplified default colors for light and dark backgrounds.
    • Title colors are simplified to a more modern single color title.
  • Customization
    • Folder #Defaults & Mods renamed to $ Customization
    • File PE - Defaults.afl renamed to PE - Configuration.afl
    • File PE - Mods.afl renamed to PE - Extensions.afl
    • The content of PE - Configuration has been highly optimized for easier and better usage.
    • LineWidth can be defined inside the configuration file for the better visual experience even on high DPI resolution screens. It is used in many tools where lines are plotted.
  • PE - 123
    • Completely redesigned
    • Sensitivity can be selected through the static amount of bars or dynamically through predefined desired pattern sizes and accuracy levels. The algorithm adjusts internal parameters automatically to find the desired patterns.
    • Patterns are clearer now and overlapping of opposite patterns have been removed.
    • Added a new accuracy mode to the 123 pattern tool to detect patterns where point 3 slightly breached point 1
    • More patterns are detected now.
  • PE - CPR 1
    • Improved Sensitivity parameter and pattern accuracy
    • Pattern size can be chosen now through static values as in previous versions or dynamically through the desired pattern length. In dynamic mode, an algorithm tries to find a pattern of the selected size, and if the detected pattern isn't valid, the algorithm attempts to find a smaller valid pattern until it finds one. While we recommend the dynamic mode, the code execution takes more time.
  • PE - CPR 2
    • The same improvements as in PE - CPR 1
  • Composite indicators
    • Changed from old AddToComposite method to static variables to increase the update speed.
    • Si - Relative Strength => Added a market strength indicator to get a comparison of the current market against the sector and industry.
    • Improved visual experience and changed the clouding indicators to a line.
  • PE - S & R
    • Sell - Filter condition: Added def_Sell condition.
  • PE - Pivots
    • Added monthly time frame into the pivot tool
  •  Technology update
    • Setup & activation improved for much better user experience
    • Setup detects your last used AmiBroker version automatically and suggests the path in the dialog. Furthermore, the correct PatternExplorer.dll will be installed automatically for 32 or 64 AmiBroker versions.
    • A necessary update of the customization files will be detected automatically and displayed accordingly. Backups are made whenever an update is essential.
    • Update to the newest technology
  • Due to the vast amount of improvements that have been made not all of them are listed here.

How to update?

The new version has improvements all over the place. It is necessary to uninstall the current version and delete all remaining PatternExplorer folders before installing the new version. Previously inserted indicators have to be re-inserted.


Happy and successful trading!

Enjoy the new version!
I'm happy to get your feedback for further improvements.
 

Anniversary

We are now 19 years in business. Thank you to all customers! We will continue to keep the good work to offer the best service possible.

Copyright © 2005 - 2024 - PatternExplorer.com - All rights reserved.
CFTC RULE 4.41

HYPOTHETICAL OR SIMULATED PERFORMANCE RESULTS HAVE CERTAIN LIMITATIONS. UNLIKE AN ACTUAL PERFORMANCE RECORD, SIMULATED RESULTS DO NOT REPRESENT ACTUAL TRADING. ALSO, SINCE THE TRADES HAVE NOT BEEN EXECUTED, THE RESULTS MAY HAVE UNDER-OR-OVER COMPENSATED FOR THE IMPACT, IF ANY, OF CERTAIN MARKET FACTORS, SUCH AS LACK OF LIQUIDITY. SIMULATED TRADING PROGRAMS IN GENERAL ARE ALSO SUBJECT TO THE FACT THAT THEY ARE DESIGNED WITH THE BENEFIT OF HINDSIGHT. NO REPRESENTATION IS BEING MADE THAT ANY ACCOUNT WILL OR IS LIKELY TO ACHIEVE PROFIT OR LOSSES SIMILAR TO THOSE SHOWN.

All information on this website are for educational purposes only and are not intended to provide financial advice. Any statements about profits or income, expressed or implied, do not represent a guarantee. Your actual trading may result in losses as no trading system is guaranteed. You accept full responsibilities for your actions, trades, profit or loss, and agree to hold PatternExplorer.com and any authorized distributors of this information harmless in any and all ways.